

This week, David Rosenberg, chief economist and strategist at Toronto-based Rosenberg Research, issued a warning on home prices.
He wrote: “The ‘Black Swan’ is the inevitable collapse in U.S. home prices — they are in the stratosphere benchmarked against all the fundamental factors that drive valuations.”
Some data does seem to support Rosenberg’s conclusion. Most worrisome, prices are high.
Home prices are up a record 16.6% year over year in May, based on the national Case-Shiller index. This Index is now 38.1% higher than it was at its 2006 peak. That peak did mark the top of a bubble.
Digging deeper, Rosenberg noted that home prices are overvalued by 25% compared with residential rents. Prices of homes are almost 50% above normalized levels when factoring in inflation and more than 25% overvalued versus income measures like the employment cost index.
Those are compelling arguments. But Rosenberg didn’t mention an important factor that shows this isn’t a bubble. Supply isn’t keeping up with demand. The chart below shows the number of homes listed for sale.
Demand Is Outpacing Supply — Driving Home Prices Upwards
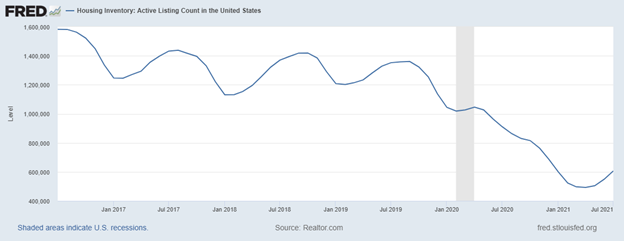
Source: Federal Reserve.
Housing Bubble Would Contradict Basic Supply and Demand
Fed data on housing inventory only goes back to July 2016. The current inventory level is down 62% since then and has been in steady decline.
Over that same time, the population of the U.S. has increased by over 8 million people. That means the demand for housing has increased while the supply of available homes has decreased. When demand increases more than supply, prices rise. That’s the situation in the current housing market.
The level of the housing inventory may have bottomed earlier this year. But there is pent-up demand, and buyers are likely to appear as supply rises. This is a market that will remain in a supply deficit for some time.
While prices may dip in some markets, a housing bubble bursting is unlikely. There simply aren’t enough homes to meet demand, and there won’t be enough supply for years.
I’m not quitting anything…
I’m just showing people a new way to make money in the markets.
My typical approach targets setups in individual stocks. With roughly 3,000 U.S. stocks, there’s plenty of opportunity.
But my new approach has simplified everything and boiled the markets down to one repeatable trade in the same ticker symbol.
The annual return was 132% last year. Click here to see how we did it. And most importantly, how it could benefit you.
Michael Carr is a Chartered Market Technician for Banyan Hill Publishing and the Editor of One Trade, Peak Velocity Trader and Precision Profits. He teaches technical analysis and quantitative technical analysis at the New York Institute of Finance. Mr. Carr is also the former editor of the CMT Association newsletter, Technically Speaking.
Follow him on Twitter @MichaelCarrGuru.


